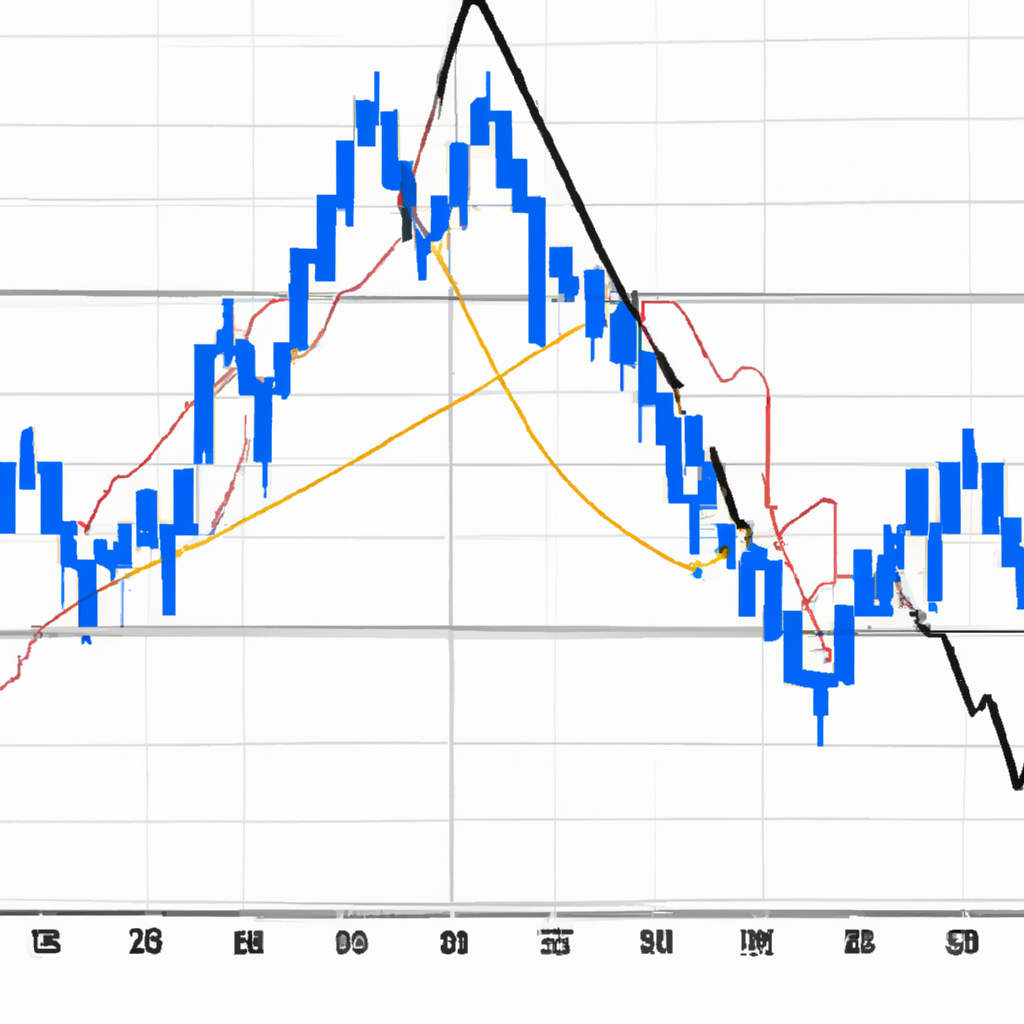
Mastering Harmonic Patterns in Forex Trading
Understanding Harmonic Patterns in Trading
Harmonic trading patterns are critical tools in the technical analyst’s toolkit, offering insights into future price movements by identifying specific geometric arrangements based on Fibonacci numbers. These patterns help traders identify potential reversals in the market, thus enabling more informed decision-making. This article will delve into what harmonic patterns are, their types, and how they can be applied in trading.
Introduction to Harmonic Trading Patterns
Harmonic trading patterns are based on the idea that price movements are partly repetitive in nature due to the psychology and behavior of market participants. These patterns take advantage of the Fibonacci sequence to predict future price movements by analyzing past market actions. When a harmonic pattern is identified, traders can use it to find potential market entry and exit points, often with a high level of precision.
Understanding Fibonacci Numbers
Before diving deeper into harmonic patterns, it’s essential to grasp the concept of Fibonacci numbers and their significance in trading. The Fibonacci sequence is a series of numbers where each number is the sum of the two preceding ones, starting from 0 and 1. This sequence has been found to have a unique relationship with the golden ratio (~1.618 or 0.618), which frequently appears in nature, architecture, art, and biology. In trading, Fibonacci retracements and extensions are derived from this sequence, serving as crucial tools for identifying potential support and resistance levels.
Types of Harmonic Trading Patterns
Several harmonic patterns are recognized for their predictive capabilities in the trading world. Each pattern has distinct characteristics, but they all share the use of Fibonacci levels to determine potential reversal points.
The Gartley Pattern
The Gartley pattern, discovered by H.M. Gartley in 1932, is often referred to as the “222” pattern, reflecting its original page number in Gartley’s book. It is a 5-point retracement structure that has specific Fibonacci measurements for each point within its structure.
The Bat Pattern
Developed by Scott Carney in 2001, the Bat pattern is distinct for its precise Fibonacci ratios. A key feature of this pattern is its deep retrace of the XA leg. This pattern provides traders with high-risk to reward ratio opportunities due to its rigorous structure.
The Butterfly Pattern
Another creation by Carney, the Butterfly pattern, offers a more flexible approach than the Bat pattern. It allows for a longer CD leg, which can extend up to 1.618 of the XA leg, presenting opportunities for traders to catch longer market moves.
The Crab Pattern
Known for providing one of the most precise potential reversal zones (PRZ), the Crab pattern, also developed by Carney, utilizes an extended XA leg up to a 1.618 Fibonacci extension, targeting a highly lucrative risk-to-reward ratio.
Applying Harmonic Patterns in Trading
Harmonic patterns can seem complex at first, but with practice, traders can learn to efficiently identify and apply these patterns to their trading strategy.
Identification of Patterns
The first step is the accurate identification of harmonic patterns, which requires understanding the specific Fibonacci ratios associated with each pattern. Traders often use technical analysis software equipped with harmonic pattern recognition tools to aid in this process.
Utilizing Proper Risk Management
Given the speculative nature of trading, employing proper risk management techniques is crucial when trading harmonic patterns. This includes setting stop-loss orders beyond the patterns’ potential reversal zone (PRZ) and calculating appropriate position sizes to manage risk effectively.
Confirmation with Other Indicators
While harmonic patterns can be powerful on their own, confirming them with other technical indicators can increase their effectiveness. For instance, looking for divergences with oscillators like the RSI (Relative Strength Index) or MACD (Moving Average Convergence Divergence) can provide additional confirmation of potential reversals.
Conclusion
Harmonic trading patterns offer a sophisticated method for traders looking to predict market reversals with a high degree of accuracy. By understanding and applying these patterns alongside other technical analysis tools and proper risk management strategies, traders can potentially enhance their trading performance. However, it’s essential to remember that no strategy guarantees success in the markets, and continuous education and experience are key components of trading success.

