Interpreting MACD Histogram: Key Signals for Traders
Understanding MACD Histogram Interpretations
The Moving Average Convergence Divergence (MACD) histogram is a popular technical indicator used by traders to analyze price momentum and potential trend reversals in the market. By understanding how to interpret the MACD histogram, traders can make more informed decisions when buying or selling assets. Here are some key interpretations of the MACD histogram:
Bullish Signal
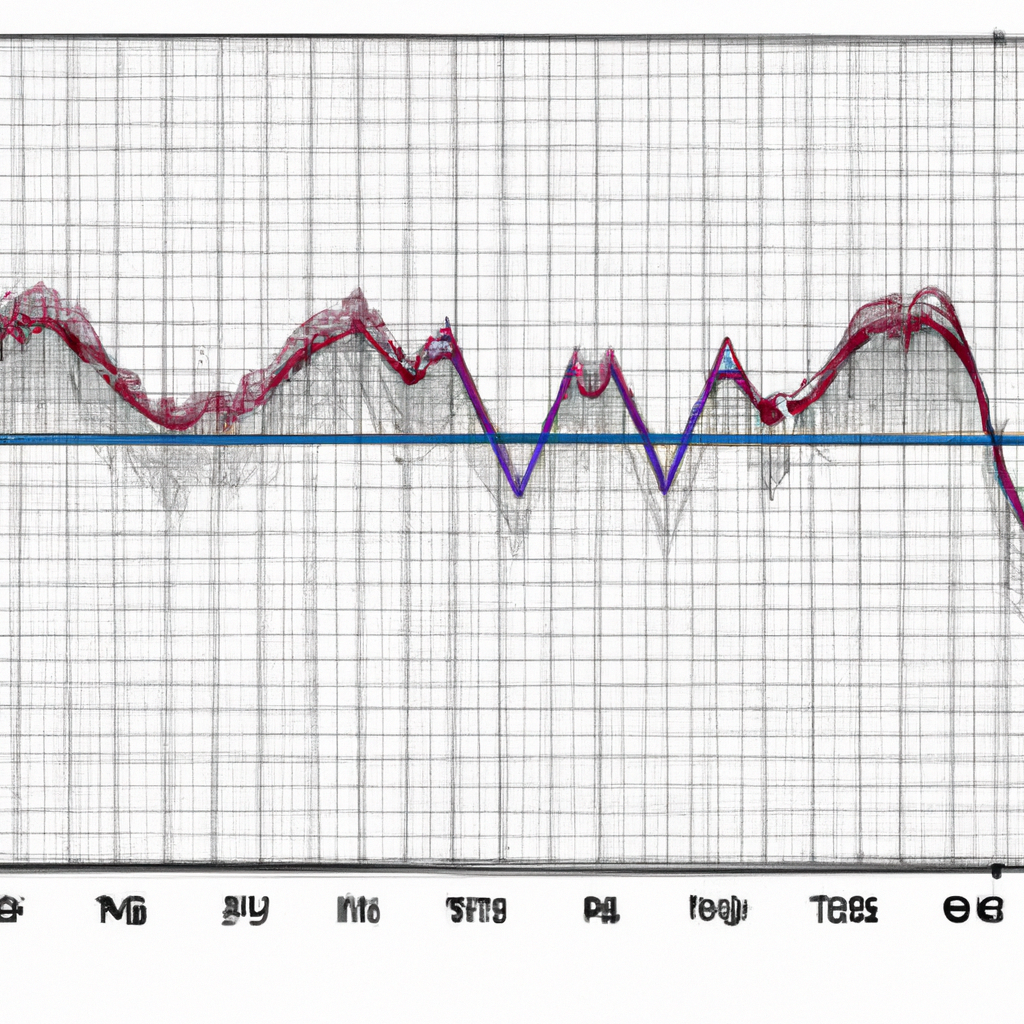
When the MACD histogram crosses above the zero line, it is considered a bullish signal. This indicates that the short-term moving average is rising faster than the long-term moving average, suggesting that the price is likely to continue moving higher in the near future. Traders may consider buying the asset at this point to take advantage of the upward momentum.
Bearish Signal
Conversely, when the MACD histogram crosses below the zero line, it is seen as a bearish signal. This suggests that the short-term moving average is falling faster than the long-term moving average, indicating that the price is likely to decline in the coming days or weeks. Traders may consider selling the asset to avoid potential losses in this scenario.
Divergence
One of the most powerful signals that the MACD histogram can provide is divergence. This occurs when the price of the asset is moving in the opposite direction of the MACD histogram. For example, if the price is making higher highs while the MACD histogram is making lower highs, it could indicate a potential trend reversal in the market. Traders should pay close attention to these divergences as they can signal significant changes in price direction.
Convergence
Convergence is another important interpretation of the MACD histogram. This happens when the price of the asset and the MACD histogram are moving in the same direction. When the two are converging, it suggests that the current trend is strong and likely to continue. Traders may use this information to confirm their trading decisions and stay in positions for longer periods.
Zero Line Cross
The zero line cross is a key signal that traders look for when interpreting the MACD histogram. When the MACD histogram crosses above the zero line, it indicates a shift from bearish to bullish momentum. Conversely, when the MACD histogram crosses below the zero line, it signals a shift from bullish to bearish momentum. These zero line crosses can be used to enter or exit trades based on the prevailing market conditions.
By understanding these key interpretations of the MACD histogram, traders can effectively analyze price momentum and make more informed trading decisions. It is important to remember that no indicator is foolproof, and traders should use the MACD histogram in conjunction with other technical analysis tools to confirm their trading strategies.

